20182018Project Management
In Project Management, there are various techniques used for project planning before initiating it. Other than the Critical Path Method, which is one of the most widely used techniques, there are also other techniques including PERT and Gantt Charts. These charts that were developed by Henry Gantt, have come a long way since they were developed during the First World War.
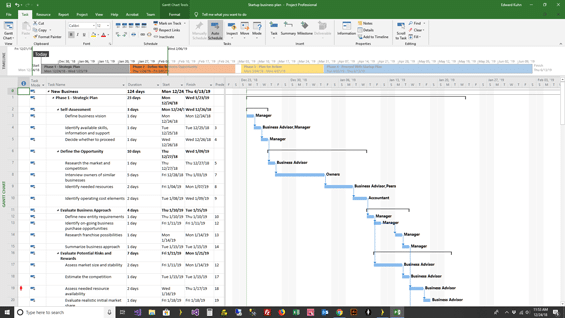
With a Gantt Chart, you are allowed to see the start and stop dates of all the project tasks as well as their subtasks. While through CPM Scheduling you get the critical activities and their completion as well as that of the project, the Gantt Chart provides you with a timeline for the entire project and its activities.
No matter what the nature of the project or its duration or how many subtasks are there in a single task, the Gantt Chart is an ideal way of getting a timeline. There are many different kinds of Gantt Charts and each is used under different conditions and services a unique purpose.
A Gantt Chart not just shows the project timeline, but also allows you to track the progress of a particular task by seeing how well it is progressing relative to the diagram. With respect to the dependence or non-dependence of an activity on another one, the critical and non-critical activities can be identified in the chart just as they can be with the use of CPM Scheduling Software.
There are many functions that a Gantt Chart serves. First, it can help with the planning phase of the project. Then it serves the function of monitoring the project’s progress. Just as we use Project Management Software in the application of the Critical Path Method, the software can also be used for the purpose of making Gantt Charts.
When it comes to the project planning, the Gantt Chart can assist is determining for how long a project should last. In addition, this chart also gives you a layout of the order or sequence in which each of the tasks should be carried out. While the earlier Gantt Charts did not give an insight into the interdependencies between tasks, the modern Gantt charts that are created with software have the capability of differentiating between critical and non-critical activities.
After the planning stage is complete, then comes the implementation phase in which the activities are started and efforts are made to complete these activities in the designated time. Gantt Charts that are created with the help of CPM Software are really useful in the monitoring of the activities. When you look at a Gantt Chart, you can instantly tell at what point the project should have been at a given point in time.
While the traditional Gantt Chart is simple, there is also the Milestone Gantt Chart that enables you to see the milestones in any project, and keeping which in consideration, you can bring the project back on track. Milestones on a Gantt Chart can be really useful in the representation of deadlines and other events that are significant.
In project planning, most of the times, many plans are created. The original plan may not always be followed. This is where another type of Gantt Chart comes in. This is the Baseline Gantt Chart, which shows the baseline, which is the original plan for the project. The current plan is also showed in the same chart so that they are easily distinguishable. One can see through this chart how many changes have been made to the original plan.
